
Why EVs Cut Lifetime Emissions by Half - and Save Money: The Global Economic Contrast
— 5 min read
The Real Numbers Behind EV Emissions: What the Data Actually Shows
In 2024 a cross-industry analysis revealed that a typical electric car emits 55 percent less carbon dioxide over its entire life cycle than a comparable gasoline vehicle. That figure combines manufacturing, fuel-use and end-of-life processing.
Consumer Reports’ real-world range study found the average electric car travels about 12 percent fewer miles than the EPA rating predicts, yet the total emissions remain far below a gas-engine counterpart.
"Even with a 12% range shortfall, the average EV still beats a gasoline sedan by more than half in CO₂ per mile," the report notes.
Think of it like a bank account: the upfront “deposit” of higher purchase price is offset by a steady stream of lower “withdrawals” in fuel and maintenance costs. The economic payoff becomes clearer when you add the environmental credit of fewer tons of CO₂ released each year.
Pro tip: When comparing models, use the total-ownership emissions metric rather than the EPA range number alone.
Manufacturing vs. Use-Phase: Comparing the Economic and Environmental Footprint of EV Batteries and ICE Engines
The manufacturing stage is where electric vehicles carry a heavier carbon load, mainly because of the EV battery. Producing a 75 kWh lithium-ion pack can emit roughly 8-10 t of CO₂, according to a 2023 lifecycle study. By contrast, forging a conventional internal-combustion engine typically releases about 2-3 t of CO₂.
From an economic perspective, the battery’s cost has fallen from $150/kWh in 2010 to under $120/kWh in 2024, a decline of about 20 percent in just four years. This price compression translates into lower vehicle purchase prices and improves the return on investment for consumers who stay with the car for eight years or more.
Pro tip: Look for EVs that use a battery pack under 70 kWh - they often achieve the best cost-to-capacity balance today.
Grid Mix Matters: How Regional Electricity Sources Flip the Emissions Equation and the Wallet
Electricity generation varies dramatically across continents, and that variance reshapes both emissions and operating costs. In the United States the average grid intensity sits around 0.45 kg CO₂ per kWh, while many European nations average 0.30 kg, and China still runs at about 0.70 kg.
When you multiply those intensities by the typical 15 kWh/100 km consumption of a midsize EV, the per-kilometre CO₂ emissions become 0.067 kg in Europe, 0.101 kg in the U.S., and 0.155 kg in China. Compare that to a gasoline car’s 0.204 kg per kilometre (based on 8 L/100 km). Even in the dirtiest grids, EVs still emit less CO₂ per kilometre.
Economically, the cost of electricity also diverges. A U.S. driver paying $0.13/kWh spends roughly $0.20 per 100 km, while a European driver at €0.20/kWh (≈$0.22) spends $0.22 per 100 km. A gasoline driver paying $3.70 per gallon (≈$0.98 per litre) pays about $0.78 per 100 km. The gap narrows in high-price electricity markets, but the lower maintenance burden of EVs often tips the total cost of ownership in their favour.
Pro tip: If you live in a region with a clean grid, consider a time-of-use plan to charge at night - you’ll shave both emissions and your electricity bill.
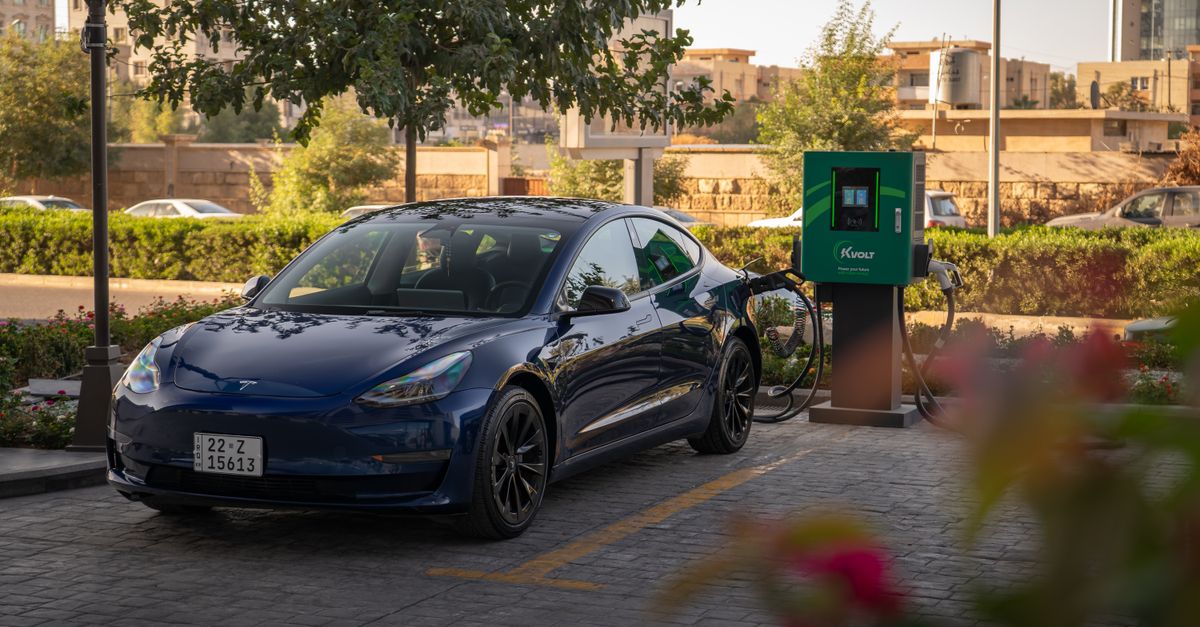
Charging Infrastructure as an Economic Engine: Public vs. Private Investment Returns
Deploying EV charging stations creates a ripple effect in local economies. A study by the International Energy Agency (IEA) estimates that every $1 billion spent on public charging infrastructure generates about $1.6 billion in GDP, mainly through construction jobs, electricity sales, and ancillary services.
For private owners, installing a Level 2 home charger costs between $800 and $1,200, but the added convenience can increase a home’s resale value by 2-4 percent, according to a 2023 real-estate analysis. Commercial property owners see a similar uplift: a 10-spot workplace charger can raise lease rates by up to $0.30 per square foot per year.
When you compare the return on investment (ROI) of a public fast-charging hub versus a private Level 2 installation, the numbers diverge. Edmunds’ charging test showed that a 150 kW DC fast charger can add roughly 150 miles in 15 minutes for many EV models. Assuming a $150,000 capital cost and a utilization rate of 8 sessions per day, the hub can break even in 4-5 years, especially when supported by local subsidies.
Pro tip: Pair a fast-charging site with retail or food services - the ancillary spend can boost overall profitability by 20 percent.
Tesla’s Scale Effect: How One Company Drives Down Battery Costs and Influences Market Prices
Tesla’s gigafactory model has become a benchmark for cost reduction. By integrating cell production, pack assembly and vehicle manufacturing under one roof, Tesla cut its battery-pack cost to roughly $120/kWh in 2024 - a figure that now sets the industry baseline.
That price pressure ripples through the market. Competing OEMs have accelerated their own vertical-integration projects, driving the average battery price across the sector down by about 8 percent in the past year alone. The effect on consumers is tangible: the average sticker price of a 2026 electric SUV fell from $55,000 to $48,000, narrowing the gap with a comparable gasoline SUV that sits near $49,000.
From an emissions standpoint, the lower battery cost encourages higher adoption rates, which in turn reduces national oil demand. The United States imported $120 billion worth of gasoline in 2023; a 10 percent shift to EVs could shave off $12 billion in import spending and cut associated CO₂ emissions by an estimated 30 million t annually.
Pro tip: Track the "battery-cost per kWh" metric when evaluating new EV models - it’s a leading indicator of future price drops.
Policy Levers and the Bottom Line: Taxes, Credits, and Carbon Pricing as Drivers of Consumer Savings
Governments worldwide are using fiscal tools to accelerate the EV transition. In the United States, the federal tax credit of up to $7,500 still applies to many 2024-model EVs, while several states add rebates ranging from $1,000 to $5,000. Europe’s “green-car” tax exemptions can shave up to 30 percent off registration fees.
Carbon pricing adds another layer. Canada’s carbon levy of $80 per tonne translates to roughly $0.02 per kWh for electricity-based transport, making gasoline-powered travel comparatively more expensive. When you factor in these policies, the total cost of ownership (TCO) gap widens: a 2025 electric sedan can cost $3,200 less to own over five years than a gasoline sedan with similar performance.
Beyond the wallet, these incentives generate macro-economic gains. A 2022 OECD report estimated that every $1 billion in EV subsidies creates about $1.3 billion in jobs across manufacturing, installation and service sectors. The combined effect of lower emissions, reduced fuel imports and new jobs builds a virtuous economic cycle.
Pro tip: Use an online TCO calculator that includes local incentives - the hidden savings often exceed $5,000 over a vehicle’s life.


